A Project Sponsored by Shell
Rocks and other geomaterials are heterogeneous materials, with a well-recognized hierarchy of defects from micro-heterogeneities on the grain level to a large-scale network of cracks and layering structures. Their nature creates a challenge for determining macroscopic properties, particularly for properties that are scale dependent, complicating both the property measurement and its appropriate application in modeling. We present the concept of a “representative volume”, which is commonly used in modeling microheterogeneous but statistically homogeneous material by an effective homogeneous continuum. In addition, we discuss its limitations in dealing with properties like strength and fracture toughness that exhibit a scale effect. This limitation is illustrated with a study of brittle fracture of a concrete where it is considered as a model for statistically homogeneous rock. The study includes the determination of a scaling rule for the scale effect in fracture toughness, and shows that the fracture of brittle materials like rocks and concrete appears in the form of highly tortuous, stochastic paths. This reflects a complex interaction between a crack and pre-existing as well as newly formed micro-defects controlled by chance, and results in a large scatter of all fracture related parameters. This behavior suggests a synthesis of Fracture Mechanics with Probability and Statistics, and so a brief exposition of Statistical Fracture Mechanics (SFM) that addresses the statistical aspects of fracture is also presented. SFM is a formalism that combines Fracture Mechanics methods with Probability Theory and serves as the basis for an adequate modeling of brittle fracture.
Representative Volume (RV)
“One grain is not a pile; neither are tow or three grains… On the other hand, everyone would agree that a hundred million of grains do make a pile. Where is the boundary? It is impossible to define the meaning of ‘a pile of grains’, if a boundary between individual grains and a pile of grains is not established. However, in everyday life it does not cause any arguments.”
— Émile Borel “Probabilité et certitude” (1950)

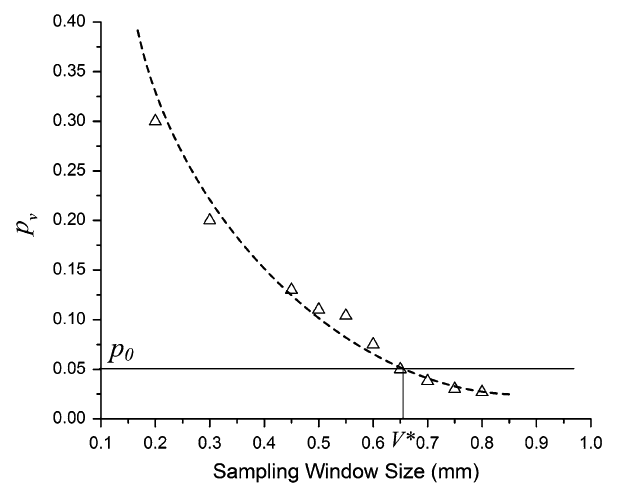
Representative Volume (RV) is usually regarded as a volume of heterogeneous material that is sufficiently large to be statistically representative of the material. For instance, the minimal sampling volume V* (on the left figure) is referred to as the RV for porosity of Torry Buff sandstone. Further enlargement of the sampling window (V>V*) would not significantly change the estimated value of average porosity. The RV method is applicable for evaluating other material characteristics such as average density, mean grain size, hardness, Young’s modulus, etc. It should be noted that the RV size is not universal but rather depends on the property in question as well as the material. However, for properties like strength and fracture toughness, the RV cannot be determined the same way due to scale effects.
Scale Effect
The scale effect in material strength is known for many centuries and has been discussed from the beginning of modern science in works by Leonardo da Vinci and Galileo Galilei. The complexity of the phenomenon leads to a common recognition of the fact that it is impossible to define the material strength the same way as we define density or porosity. Instead, one can specify a standard specimen and strength test protocol, together with the formulation of scaling rules that would allow extrapolating the standard test data to different shape and size structures.

To address the scale effect in fracture toughness, we prepared a large set of concrete specimens with different sizes. All specimens were made in the shape of
square plates with the same ratio of the plate side to its thickness. We made five groups of specimens with a scaling factor of two. For each group of specimens, different maximum aggregate sizes were also scaled by a factor of two in order to observe the interplay between the microstructural dimensions and macroscopic specimen size. Multiple tests were conducted with each combination of macroscopic size and aggregate size due to the inevitable scatter. Crack trajectories, load-displacement relationship were recorded. Thus, the critical value of energy release rate (fracture toughness) was evaluated.

scaling with aggregate size. S1, S3, and S4 stand for sample size; A3, A32, A34, A38 and A316 designate maximum aggregate size.
The results show:
1) The fracture toughness is not constant, rather a consistent increasing trend with crack length;
2) For the same size specimen, the apparent fracture toughness increases with maximum aggregate size;
3) For the groups with the same maximum aggregate size, the apparent fracture toughness increases with specimen size;
4) For the self-similar groups of specimens, the apparent fracture toughness for the same a/W ratio in the larger specimens are noticeably higher than that in the smaller ones;
5) In macroscopically identical specimens with smaller aggregate size, the crack path is less tortuous, or alternatively speaking the crack trajectory deviates more from a rectilinear path in the specimens with larger aggregate size.
Statistical Fracture Mechanics (SFM)
The scale effect in fracture toughness, like that in strength, is manifested in its dependency on the shape and size of test specimens as well as on micro-structural parameters like grain size. The modeling of crack growth mechanisms controlled by chance and associated with a scale effect calls for a synthesis of fracture mechanics with probability and statistics.

The formalism of SFM directly reflects the observed features of the brittle fracture process expressed in form of a few postulates:
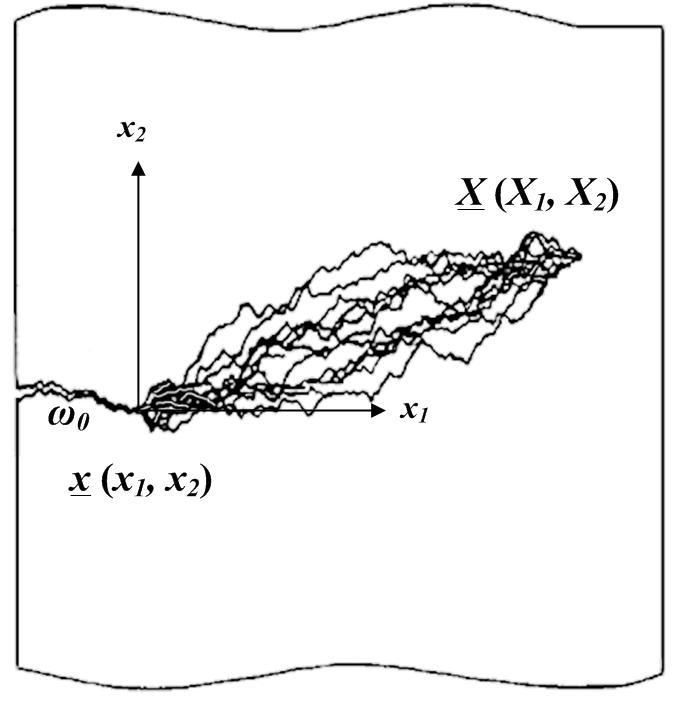
1) There is a set Ω of possible fracture paths under each loading condition. Each observed crack path is a random sampling from Ω;
2) Crack propagation along a particular path consists of a sequence of elementary steps controlled by the Griffith criterion;
3) The specific fracture energy 2ϒ is a random field that represents on a continuum level the resistance to crack growth that accounts for the population of newly formed and/or preexisting population of micro-defects along the crack path ω. It is characterized by a fracture surface roughness, point-wise distribution of ![]() and correlation distance r0 of ϒ-field. Thus, the Griffith condition along ω(x) becomes:
and correlation distance r0 of ϒ-field. Thus, the Griffith condition along ω(x) becomes:![]() .
.
The crack propagator P(x, X) is defined as the probability that a crack extends from point x to point X along at least one of the paths ω from Ω. Assuming that the actual crack propagates along only one trajectory and formations of two or more crack paths are mutually exclusive events, the crack propagator can be expressed as follows: .
.
In addition, we use an approximation of the ERR functional of the crack trajectory by a function of the crack tip coordinate. It reduces the functional integration to the solution of a diffusion type partial differential equation as follows:
These two equations are direct analogs of the well-known “forward” and “backward” Kolmogorov equations in statistical theory of diffusion and the coefficient D in these equations is referred to as the crack diffusion coefficient based on such an apparent analogy. These two equations present the “Crack Diffusion Model”. Such a model allows one to employ the well-developed formalism
of the statistical theory of diffusion for evaluating the crack propagator. The crack diffusion model is a simplified version of
SFM that can be treated analytically. It is a convenient tool to analyze basic assumptions, potentials and limitations of the proposed model. The apparent fracture toughness depends on the hierarchy of microheterogeneities via a crack diffusion coefficient that represents the fracture surface roughness directly related to material heterogeneities.
